 PSMAcpc Cloud Computing
The PSMAcpc Physiological Signals Modeling Algorithm, Cloud Computing can accurately identify the sleep health status, including sleep stages (Deep sleep, Light sleep, REM, Awakening), AHI sleep apnea, HRV autonomic nerve activity, the balance of Yin and Yang, etc. According to the results of the PSMAcpc calculation, a report is made to distinguish between health and suboptimal health, and use it as a tracking indicator for health conditioning.
The report information will include:
Summary of Sleep Monitoring (personal information, summary of sleep results, sleep stage and stable deep sleep fragment), ECG scattergram (Lorenz Plot & RR successive Different Plot), Yin Yang Coordination, HRV (Heart Rate Variability), Midnight-noon and Ebb-flow Doctrine (Ziwu Liuzhu), Sleep Sequence Diagram (sleep stage, heart rate, breath rate, body position, LF/HF, HF and LF), Sleep Stages (with heart rate, respiratory rate, sleep position), Respiratory Event.
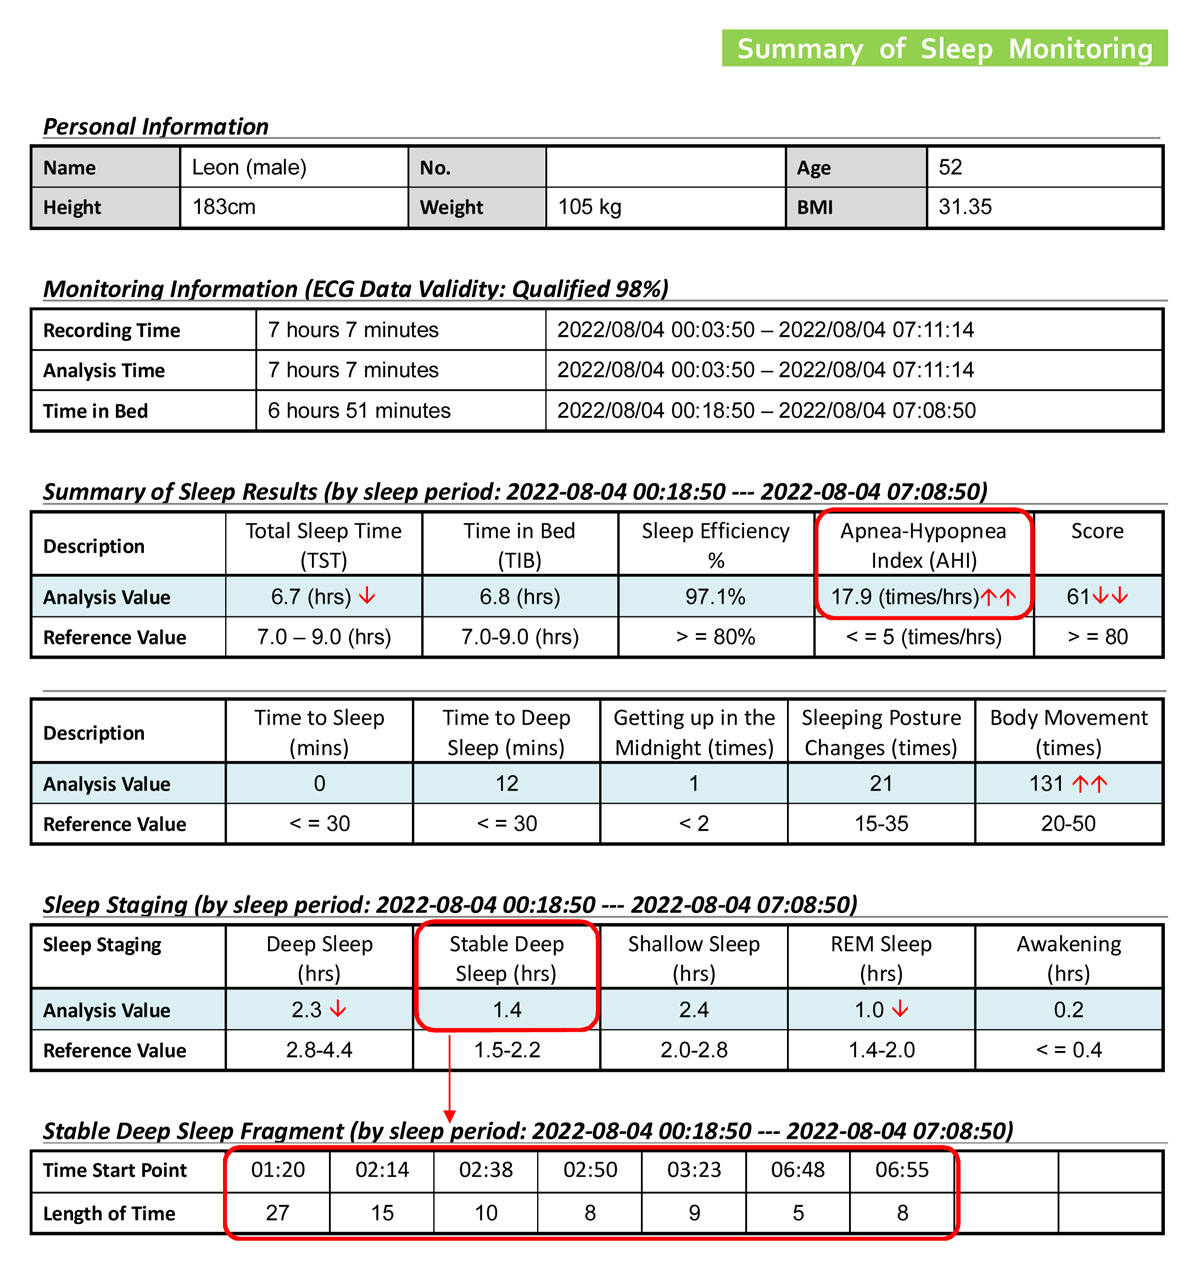
The report presentation will have summary of sleep monitoring which are:
ECG Data Validity
To see if ECG data is validity for analysis.
Quantity of Sleep
Total sleep time (TST) is an objective measure, based on the readings from electrodes recording Sinus rhythm, of the amount of time you actually sleep during monitoring.
Sleep Efficiency
The ratio between the total sleep time and the total recording time, or TRT, is called the sleep efficiency.
Apnea-Hypopnea Index (AHI)
AHI is an index used to indicate the severity of sleep apnea.
Sleep Stages
Over the course of the night, you will cycle repeatedly from Deep sleep + Stable Deep sleep, Shallow sleep, REM to Awakening. The structure of these cycles is also known as sleep architecture. It is to indicate whether you are getting the restorative sleep you need to feel and be well.
Stable Deep Sleep Fragment
PSMAcpc can accurately identify deep sleep to unstable and stable state. This table is to show in which period you have stable deep sleep over the course of the night.
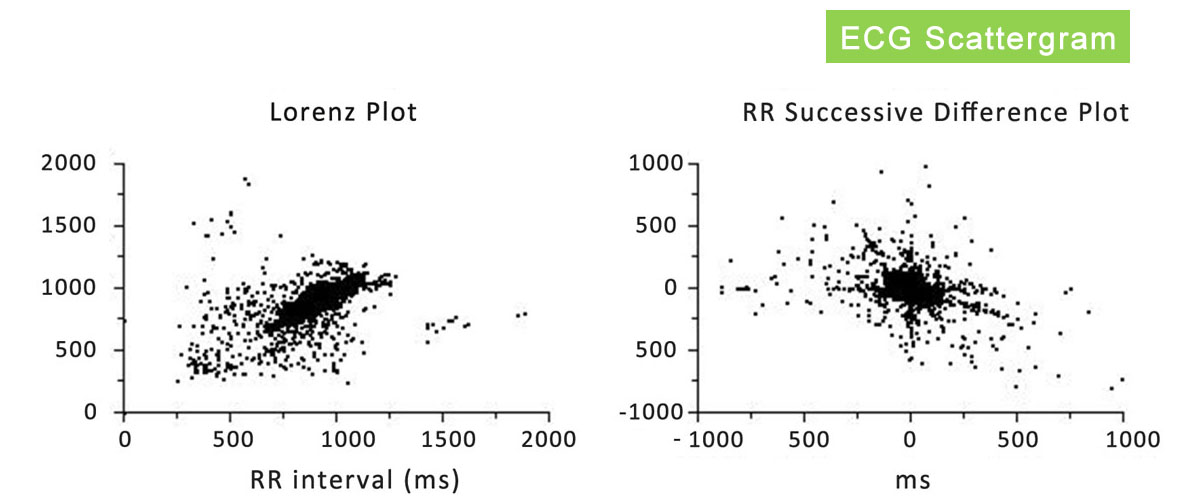
ECG Scattergram is a new technology and new method for analyzing massive ECG data. It uses an iterative calculation algorithm to create a dynamic system graph of the RR interval sequence and expresses the long-term ECG data in a new form. It was found that long-term ECG data have strong nonlinear dynamic system characteristics, and these characteristics can provide important information that traditional ECG diagnostic methods cannot provide. From the ever-changing ECG phenomena and ECG scatter diagrams in the massive ECG data, it is faster and more accurate to interpret and solve the diagnosis of arrhythmia in the massive ECG data. Simply put, the Lorenz Plot on the left is better like a baseball bat, and the RR Successive Difference Plot on the right is better like a baseball, which means the lower the number of arrhythmias.
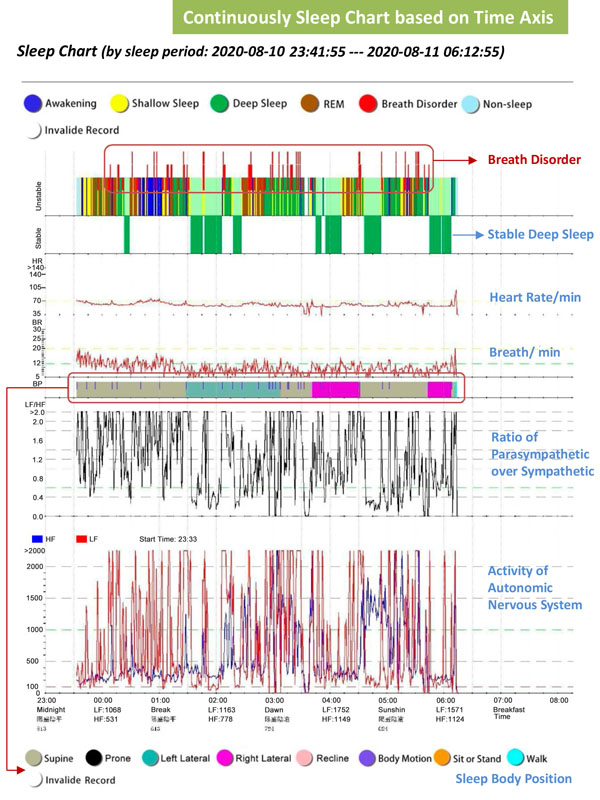
The sleep chart of PSMAcpc is illustrated in the figure on the right. On the unstable sleep chart, they are mixed with deep sleep, Shallow sleep, awakening, REM, apnea, hypopnea, etc. In the stable sleep chart, there are several green blocks represented a period of stable sleep. At the same time axis, we also added the balance of autonomic nerves and the activity of sympathetic and parasympathetic nerves, as well as changes in body position. The body position is the sleeping posture during sleep. We record bio-signal in more detail and integrate other physiological signals to construct this sleep chart.
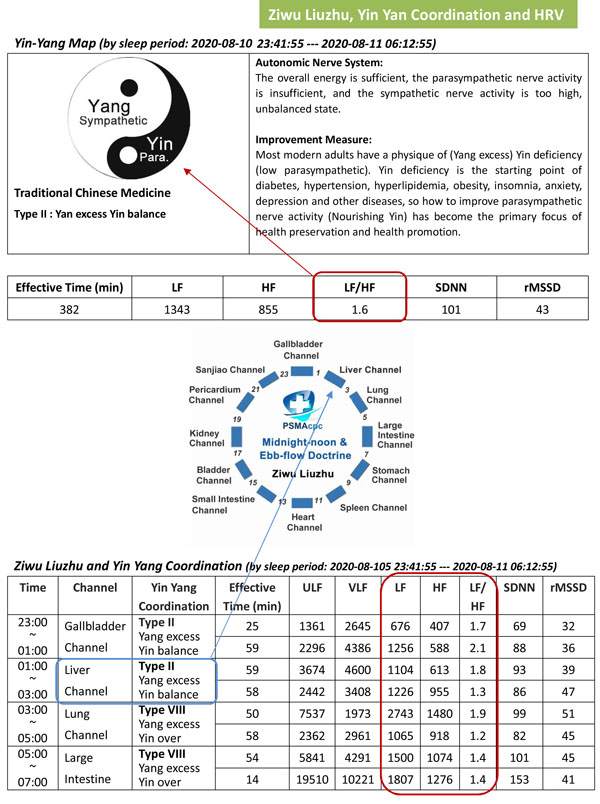
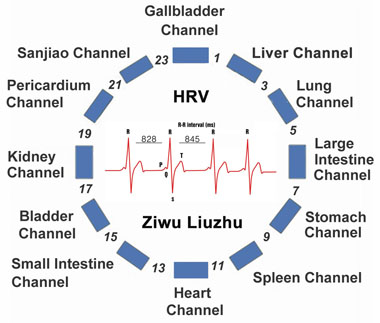 For many years, we have been studying how to effectively integrate these physiological signals not only on sleep health monitoring but also on tradition Chinese medicine. PSMAcpc collects data of sympathetic and parasympathetic values for one hour (red frame) which can see a balance and activity change of the autonomic nervous system. With the concept of traditional Chinese medicine (TMC) time and the changes in Ziwu Liuzhu, these data can show the harmony and prosperity of Yin & Yang of each TMC time. It can be used as a communication bridge between Chinese and Western medicine diagnosis, which can make the treatment plan more effective.
The report information will include:
Summary of Sleep Monitoring (personal information, summary of sleep results, sleep stage and stable deep sleep fragment), ECG scattergram (Lorenz Plot & RR successive Different Plot), Yin Yang Coordination, HRV (Heart Rate Variability), Midnight-noon and Ebb-flow Doctrine (Ziwu Liuzhu), Sleep Sequence Diagram (sleep stage, heart rate, breath rate, body position, LF/HF, HF and LF), Sleep Stages (with heart rate, respiratory rate, sleep position), Respiratory Event.

The report presentation will have summary of sleep monitoring which are:
ECG Data Validity
To see if ECG data is validity for analysis.
Quantity of Sleep
Total sleep time (TST) is an objective measure, based on the readings from electrodes recording Sinus rhythm, of the amount of time you actually sleep during monitoring.
Sleep Efficiency
The ratio between the total sleep time and the total recording time, or TRT, is called the sleep efficiency.
Apnea-Hypopnea Index (AHI)
AHI is an index used to indicate the severity of sleep apnea.
Sleep Stages
Over the course of the night, you will cycle repeatedly from Deep sleep + Stable Deep sleep, Shallow sleep, REM to Awakening. The structure of these cycles is also known as sleep architecture. It is to indicate whether you are getting the restorative sleep you need to feel and be well.
Stable Deep Sleep Fragment
PSMAcpc can accurately identify deep sleep to unstable and stable state. This table is to show in which period you have stable deep sleep over the course of the night.

ECG Scattergram is a new technology and new method for analyzing massive ECG data. It uses an iterative calculation algorithm to create a dynamic system graph of the RR interval sequence and expresses the long-term ECG data in a new form. It was found that long-term ECG data have strong nonlinear dynamic system characteristics, and these characteristics can provide important information that traditional ECG diagnostic methods cannot provide. From the ever-changing ECG phenomena and ECG scatter diagrams in the massive ECG data, it is faster and more accurate to interpret and solve the diagnosis of arrhythmia in the massive ECG data. Simply put, the Lorenz Plot on the left is better like a baseball bat, and the RR Successive Difference Plot on the right is better like a baseball, which means the lower the number of arrhythmias.

The sleep chart of PSMAcpc is illustrated in the figure on the right. On the unstable sleep chart, they are mixed with deep sleep, Shallow sleep, awakening, REM, apnea, hypopnea, etc. In the stable sleep chart, there are several green blocks represented a period of stable sleep. At the same time axis, we also added the balance of autonomic nerves and the activity of sympathetic and parasympathetic nerves, as well as changes in body position. The body position is the sleeping posture during sleep. We record bio-signal in more detail and integrate other physiological signals to construct this sleep chart.
 For many years, we have been studying how to effectively integrate these physiological signals not only on sleep health monitoring but also on tradition Chinese medicine. PSMAcpc collects data of sympathetic and parasympathetic values for one hour (red frame) which can see a balance and activity change of the autonomic nervous system. With the concept of traditional Chinese medicine (TMC) time and the changes in Ziwu Liuzhu, these data can show the harmony and prosperity of Yin & Yang of each TMC time. It can be used as a communication bridge between Chinese and Western medicine diagnosis, which can make the treatment plan more effective.


